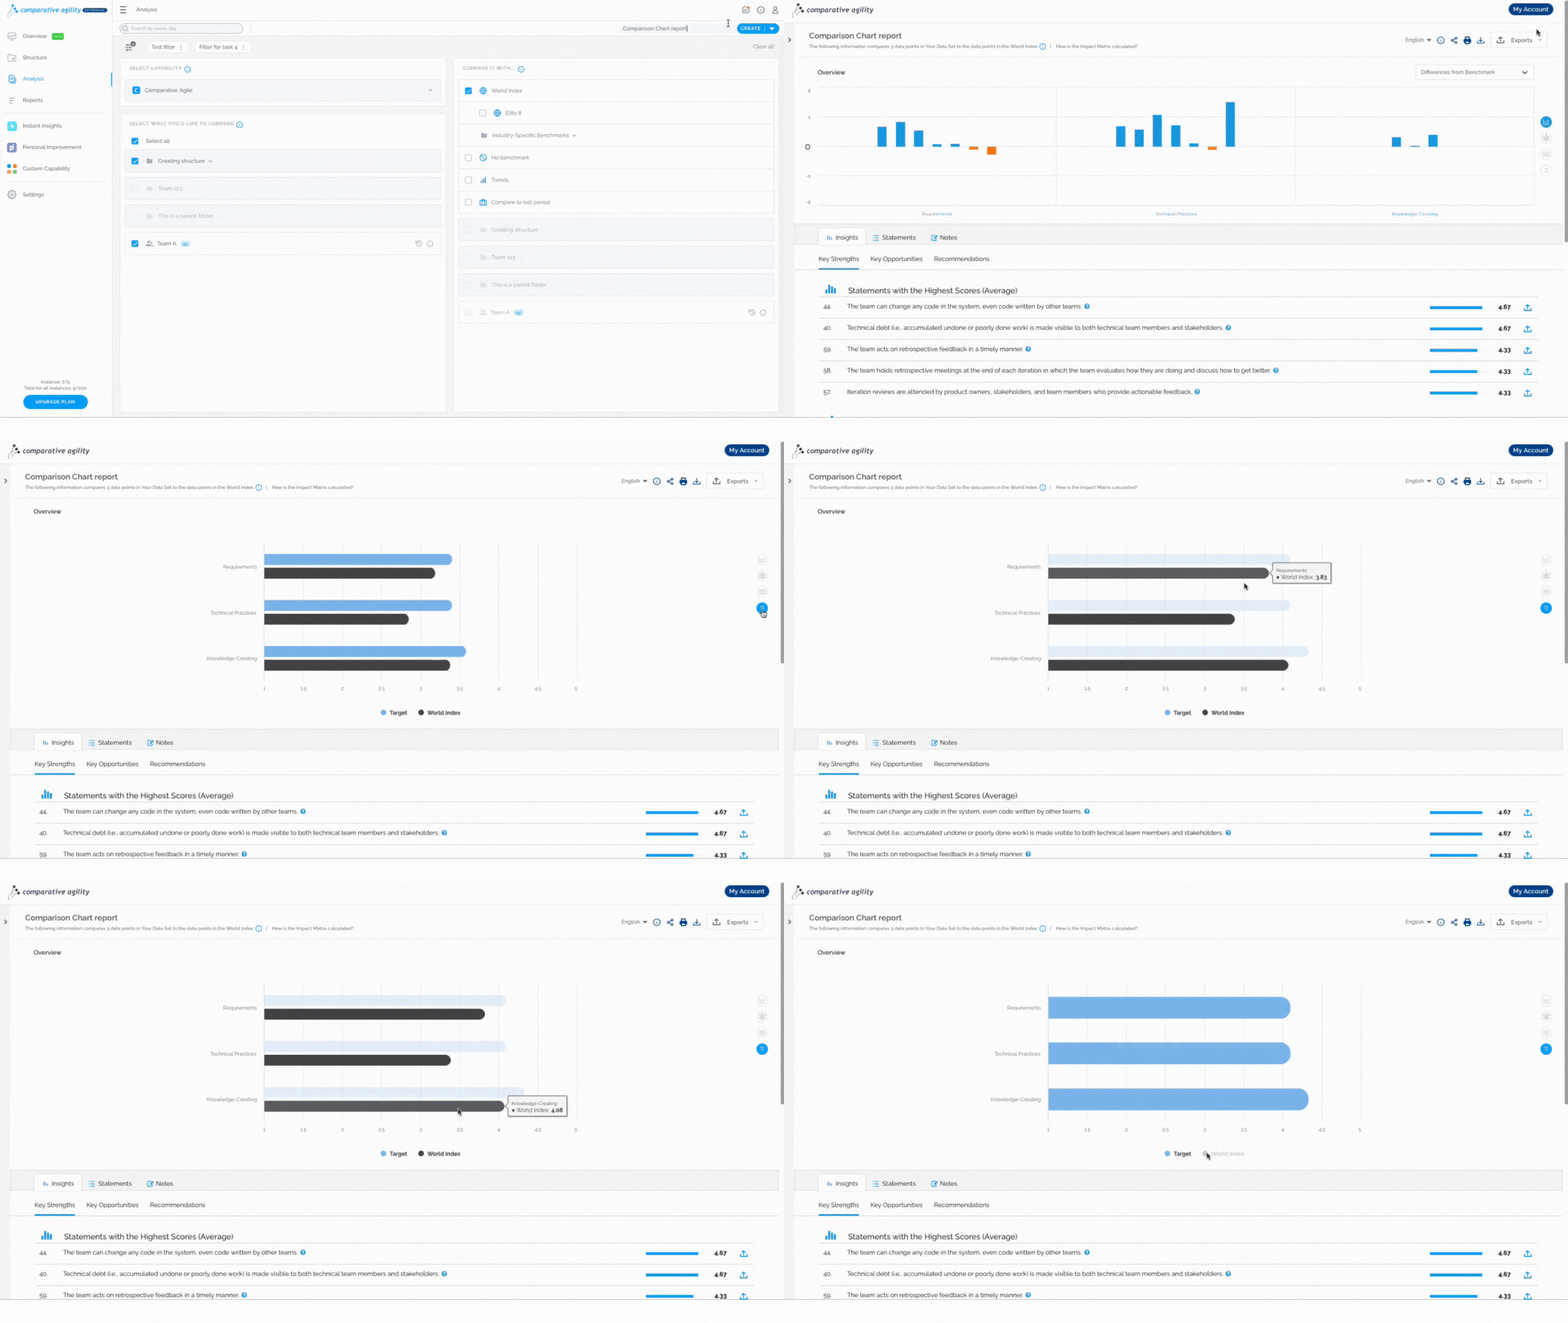
We are thrilled to introduce a great feature in Comparative Agility – the Comparison Chart. This powerful tool empowers users to benchmark their organization or teams against various data sets, including the world index, specific industry benchmarks, and data sets across two different points in time. By leveraging the Comparison Chart, you can gain invaluable insights, identify areas for improvement, and align your organization with industry-leading standards for success.
Navigating to the Comparison Chart
Start by generating a comprehensive report using Comparative Agility, which includes valuable insights and recommendations.
- Create new or open already existing report
- Navigate to the Comparison option
In the short video below we show you how to navigate to the Comparison Chart

To learn more about generating a report, please visit our Help Center article Analysis Screen.
The Comparison Chart in Comparative Agility empowers users with an invaluable tool for benchmarking and data-driven decision-making. By comparing your organization or teams against the world index, industry benchmarks and data sets across two different points in time, you gain valuable insights and identify areas for improvement.
If you ever need any assistance or have any questions please reach out to our support team at support@comparativeagility.com and we will be more than happy to assist you.
