
The Analysis screen in Comparative Agility is a powerful tool that enables you to generate actionable reports and gain valuable insights from your data. This article provides an overview of the features and functionalities available on the Analysis screen, empowering you to compare performance, identify trends, assess progress, and create or preview reports.
Navigating to the Analysis Screen
- Log in to your Comparative Agility account
- Open Analysis Screen
In the screenshot below we show you how to navigate to the Analysis Screen
Layout
- Left Panel
The left part of the Analysis screen displays your data, presenting a comprehensive view of your organization’s assessment results. This section allows you to navigate and select specific data points for analysis.
The screenshot below shows you left panel
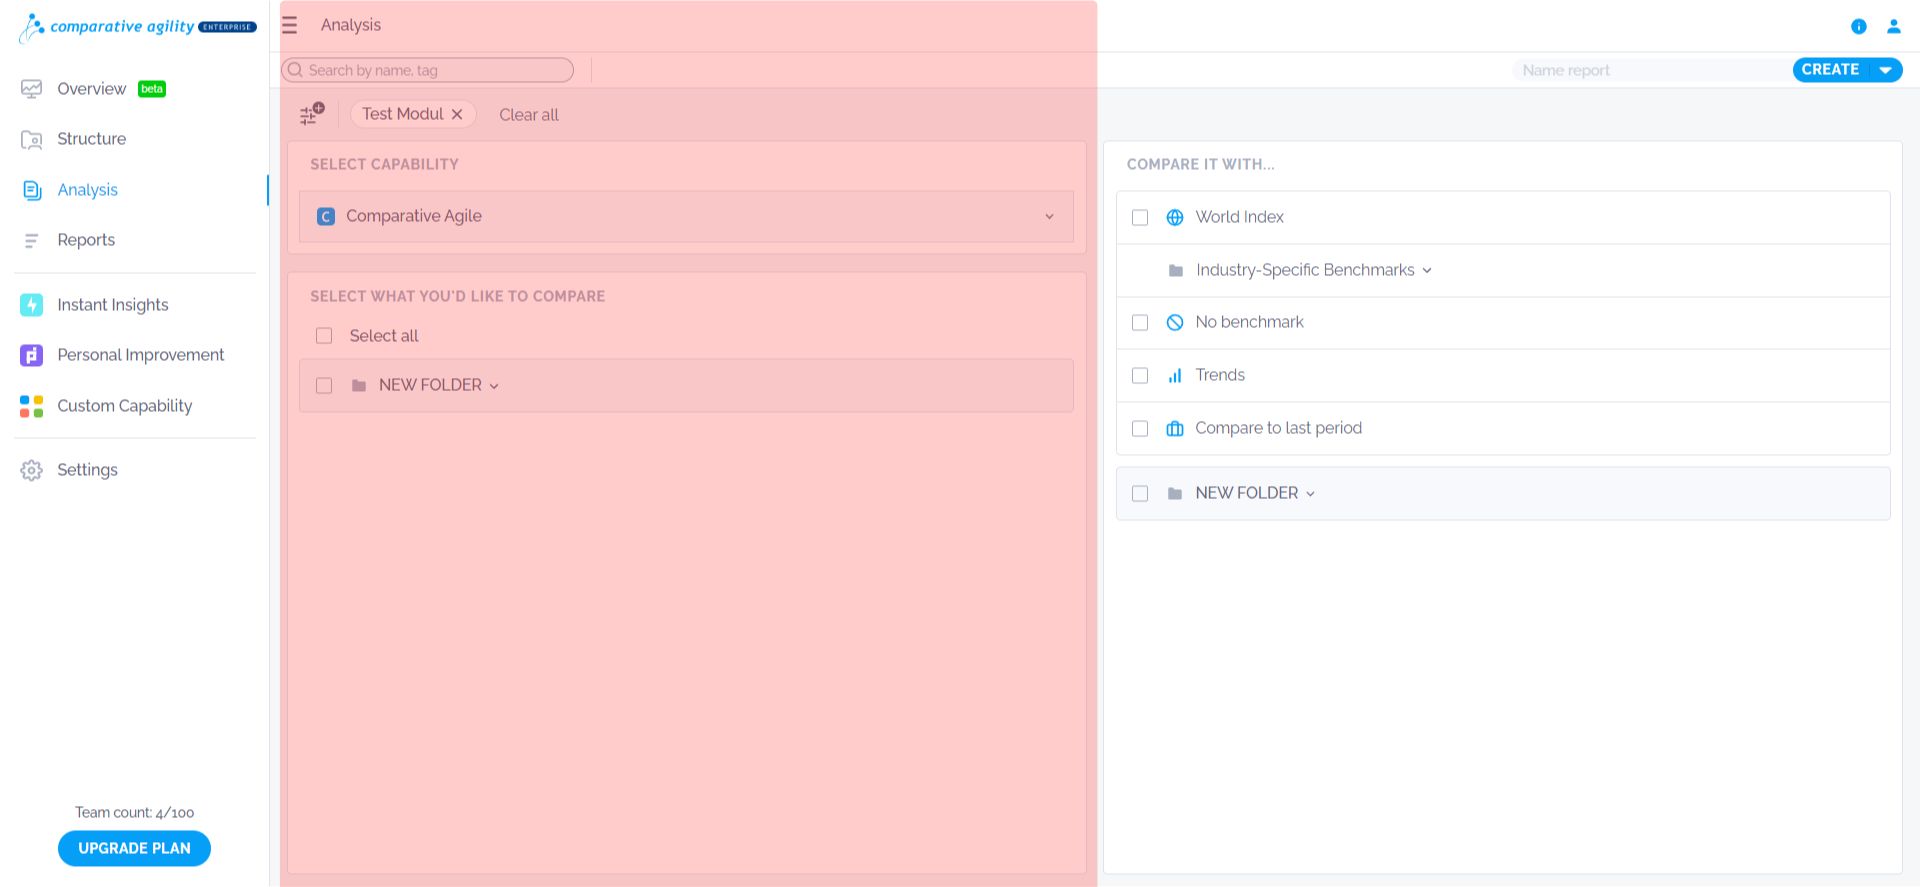
- Right Panel
The right part of the Analysis screen provides you with the ability to compare your data with benchmarks or other reference points. This section allows you to choose the appropriate benchmarks or reference data to make meaningful comparisons.
In the screenshot below we show you the right panel

Generating reports
- Within the Analysis screen, choose data points from the left panel
- On the right panel, select the desired benchmark or reference data for comparison
- Preview the report or Create it with the Create Report button
The short video below shows you how to create a report
Note: The created report will be automatically saved on the Reports Screen for future reference and analysis.
To learn more about analysis, please visit our Help Center article Performing Analysis.
If you ever need any assistance or have any questions please reach out to our support team at support@comparativeagility.com and we will be more than happy to assist you.