This article will guide you through the key components of the Overview page, empowering you to gain a holistic understanding of your assessments, team dynamics, and areas of strength. The Overview page in Comparative Agility provides a comprehensive snapshot of your organization’s performance, insights, and recommendations.
Navigating to the Overview Screen
- Log in to your Comparative Agility account
- Open Overview Screen
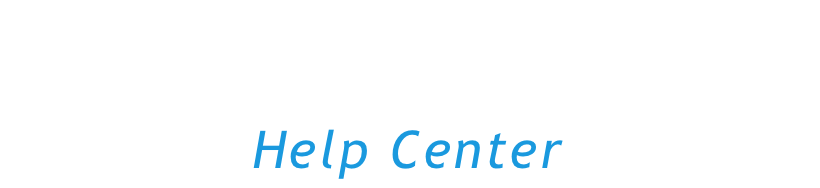
The screenshot below shows you where to find the Overview Screen
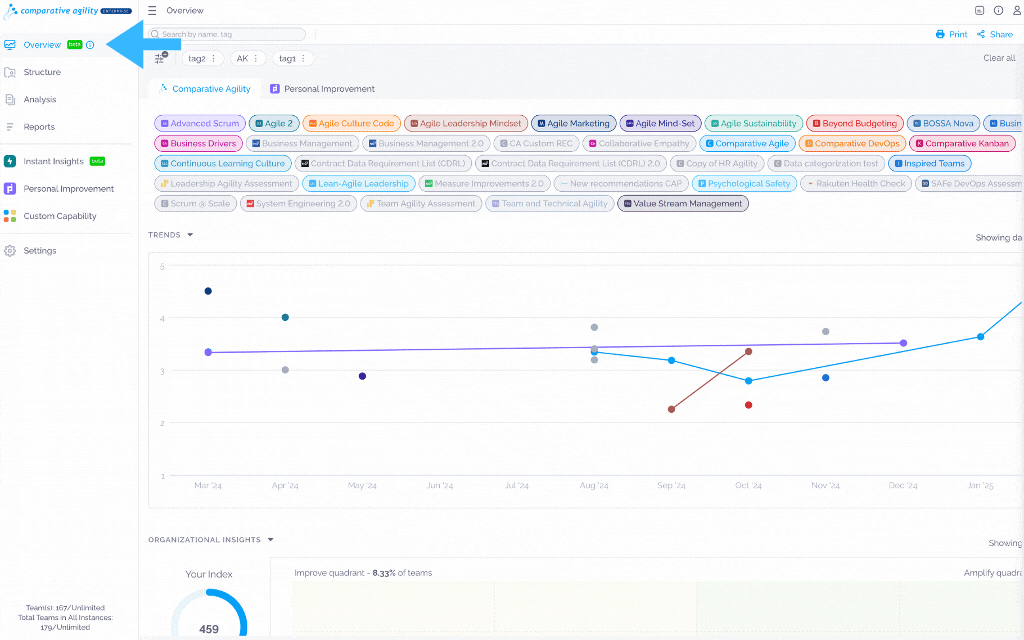
Comparative Agility Tab
The Comparative Agility tab offers a thorough snapshot of your organization’s performance and provides valuable insights for analysis.
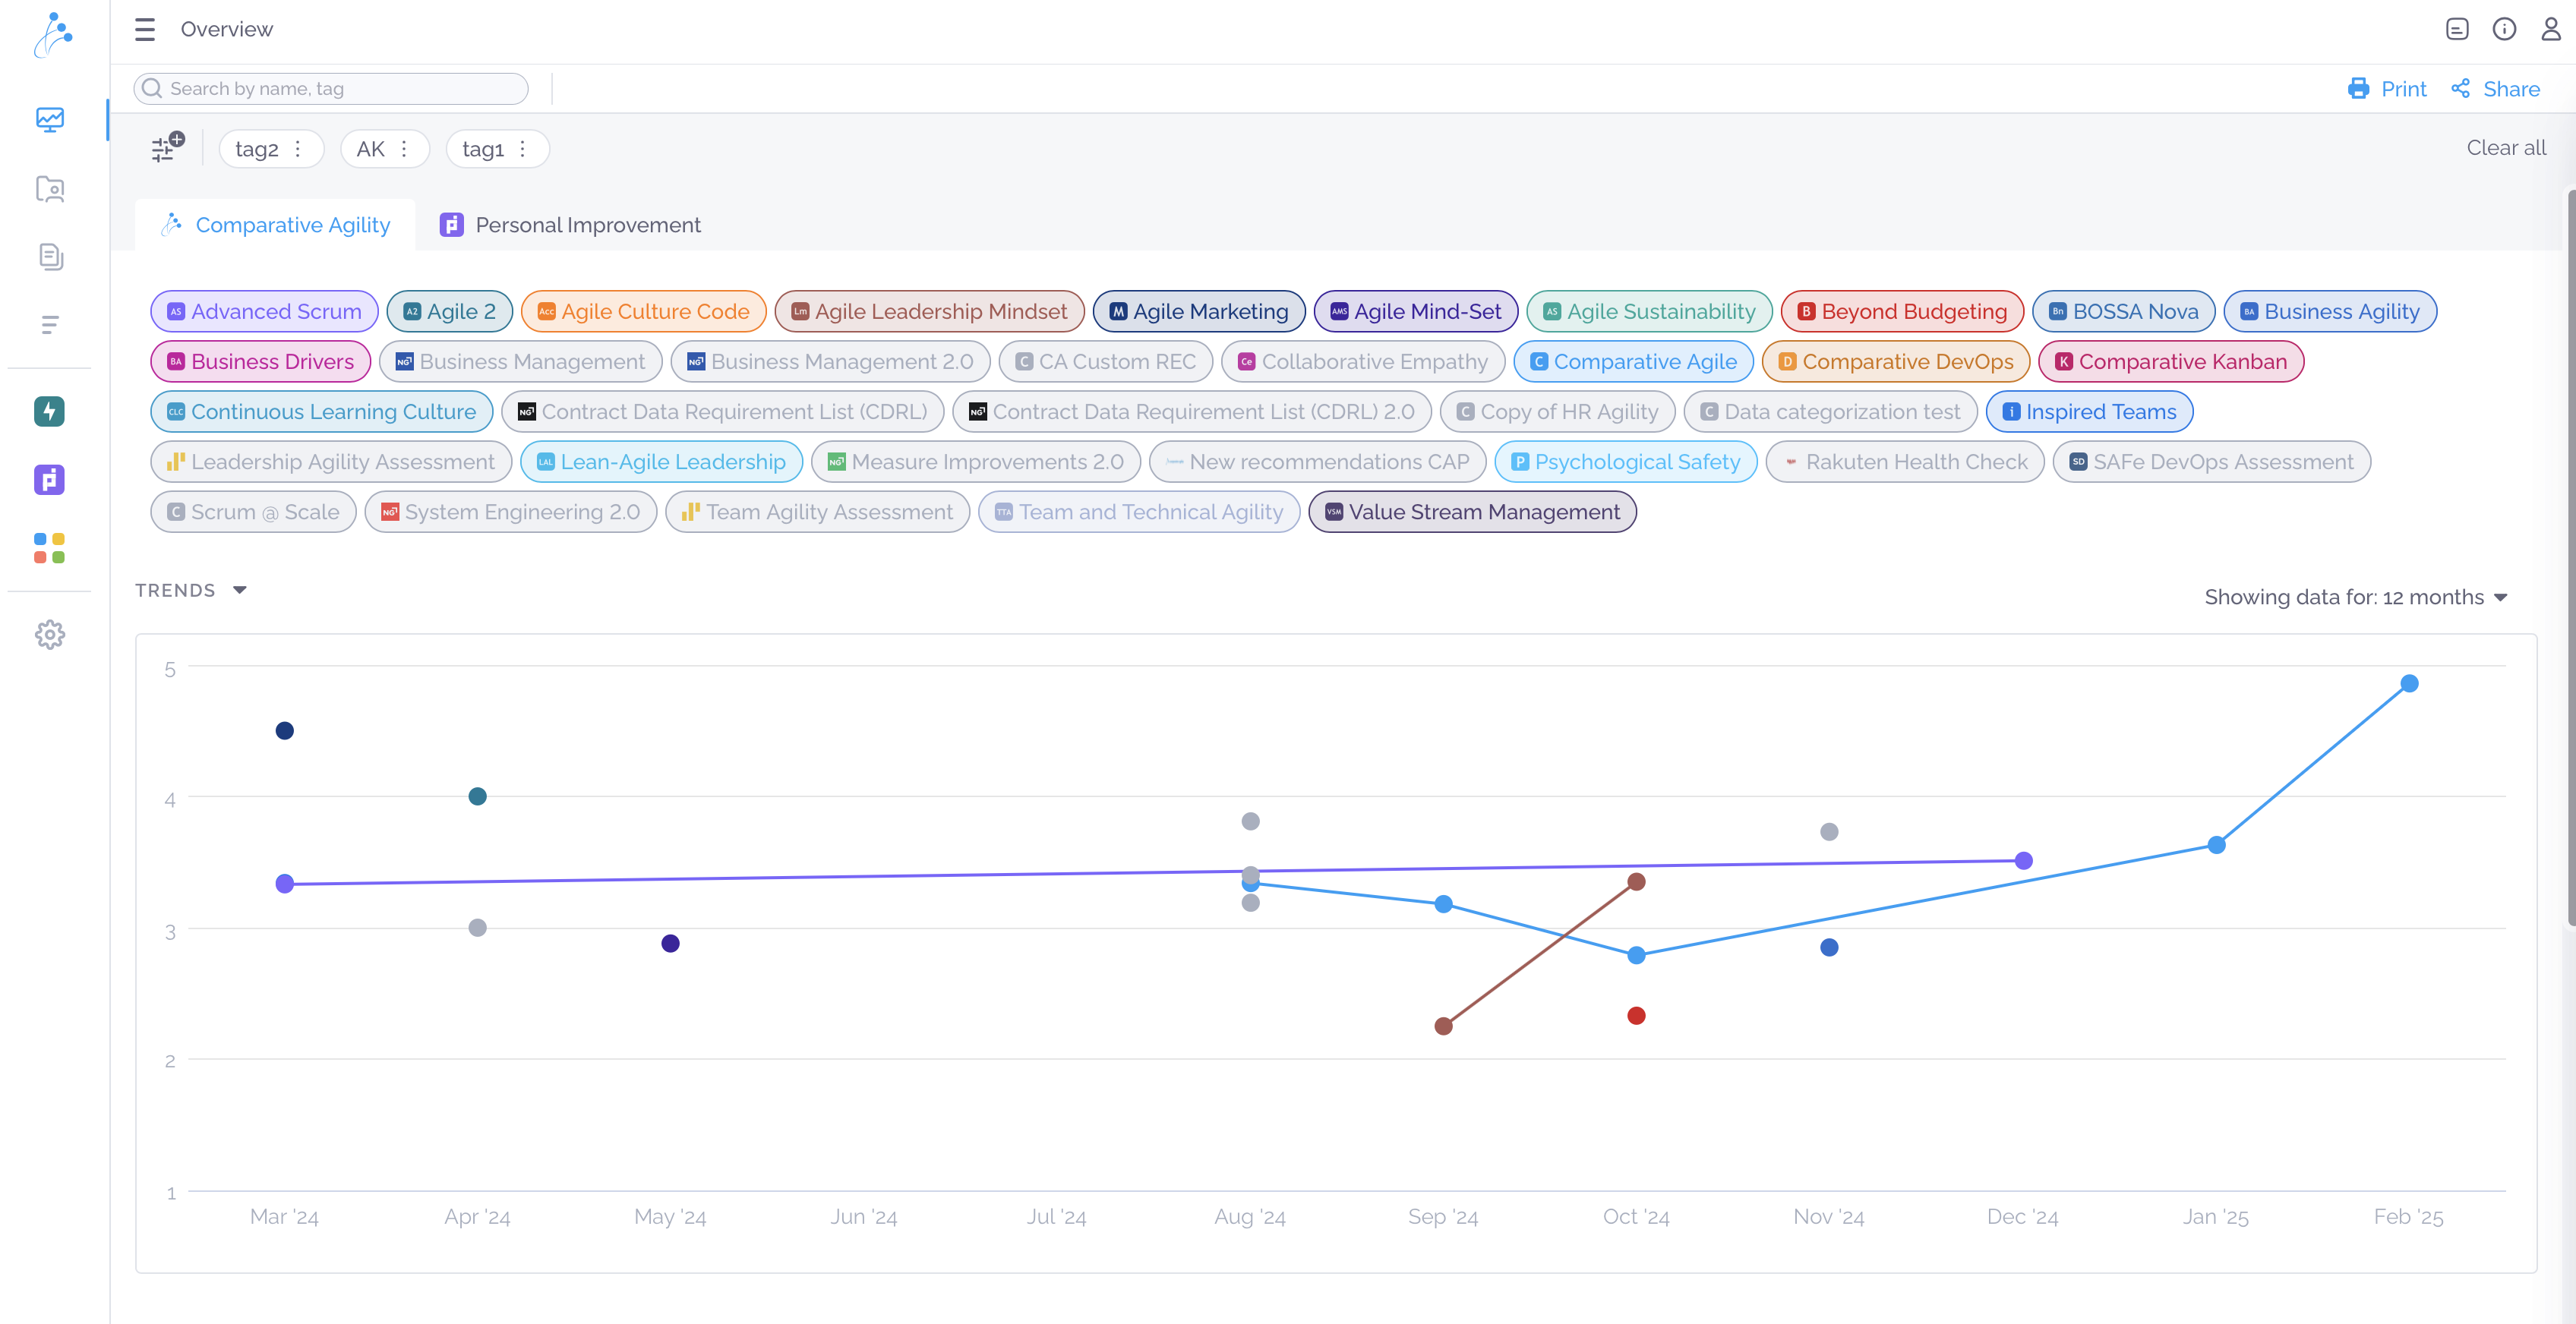
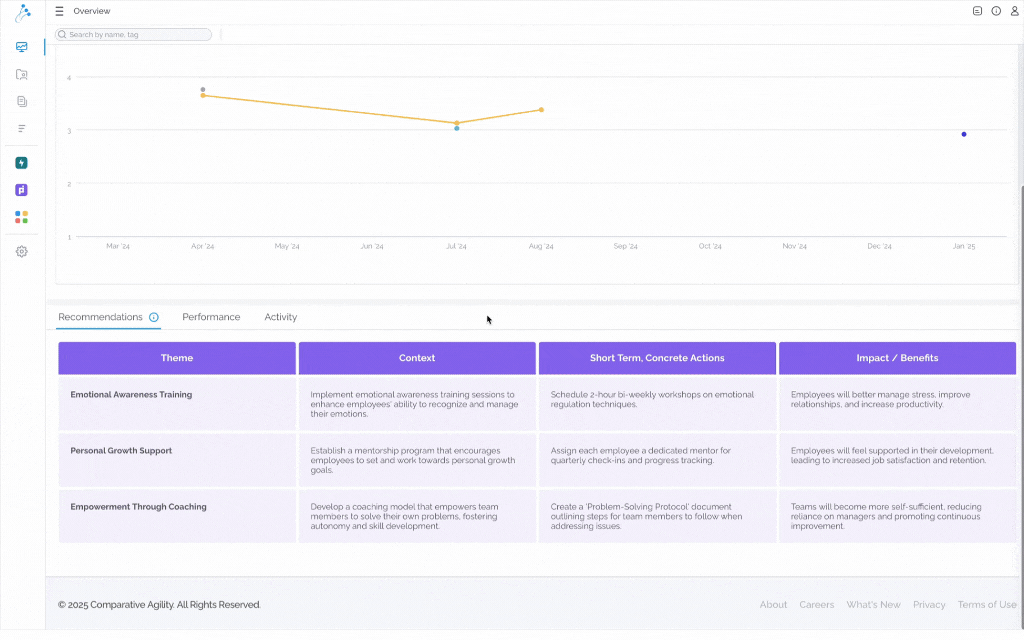
Trends
At the top of the Overview Screen, you will find the Trends section. Enter the Comparative Agility Trends Report, your compass for navigating the agile landscape. This report unveils trends, providing invaluable insights for businesses striving to excel in today’s dynamic world.
In the screenshot below we show you what the Trends look like
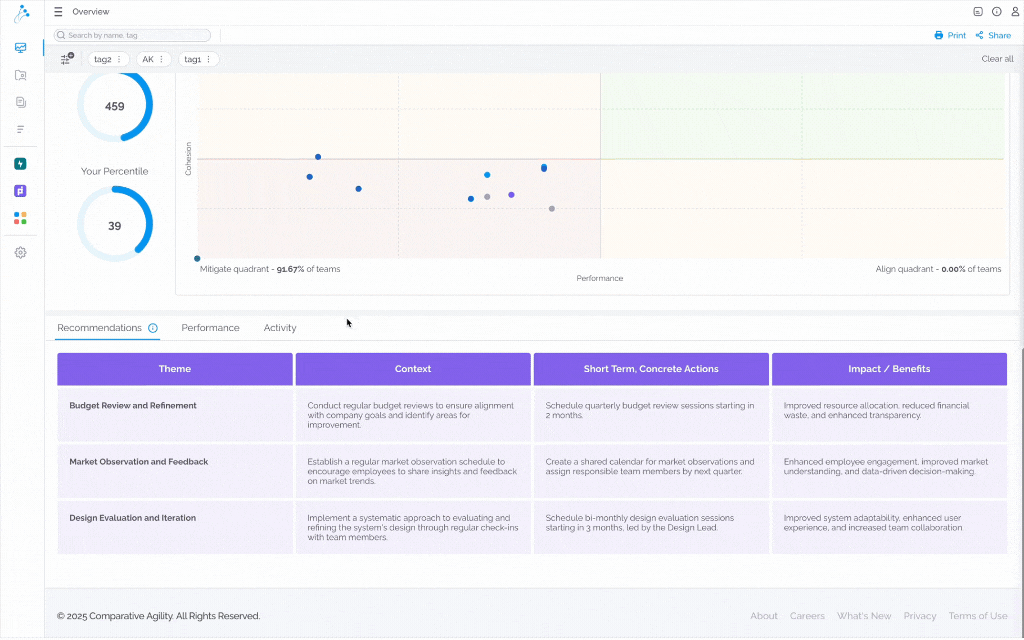
Organizational Insights
The Overview page also features the Organizational Insights section. Here, you will find the Impact Matrix, a powerful visualization that illustrates the level of cohesion and performance across your teams. The Impact Matrix provides valuable insights into teams that require attention or improvement, but also those who need to amplify their activities.
The screenshot below shows you what the Impact Matrix looks like
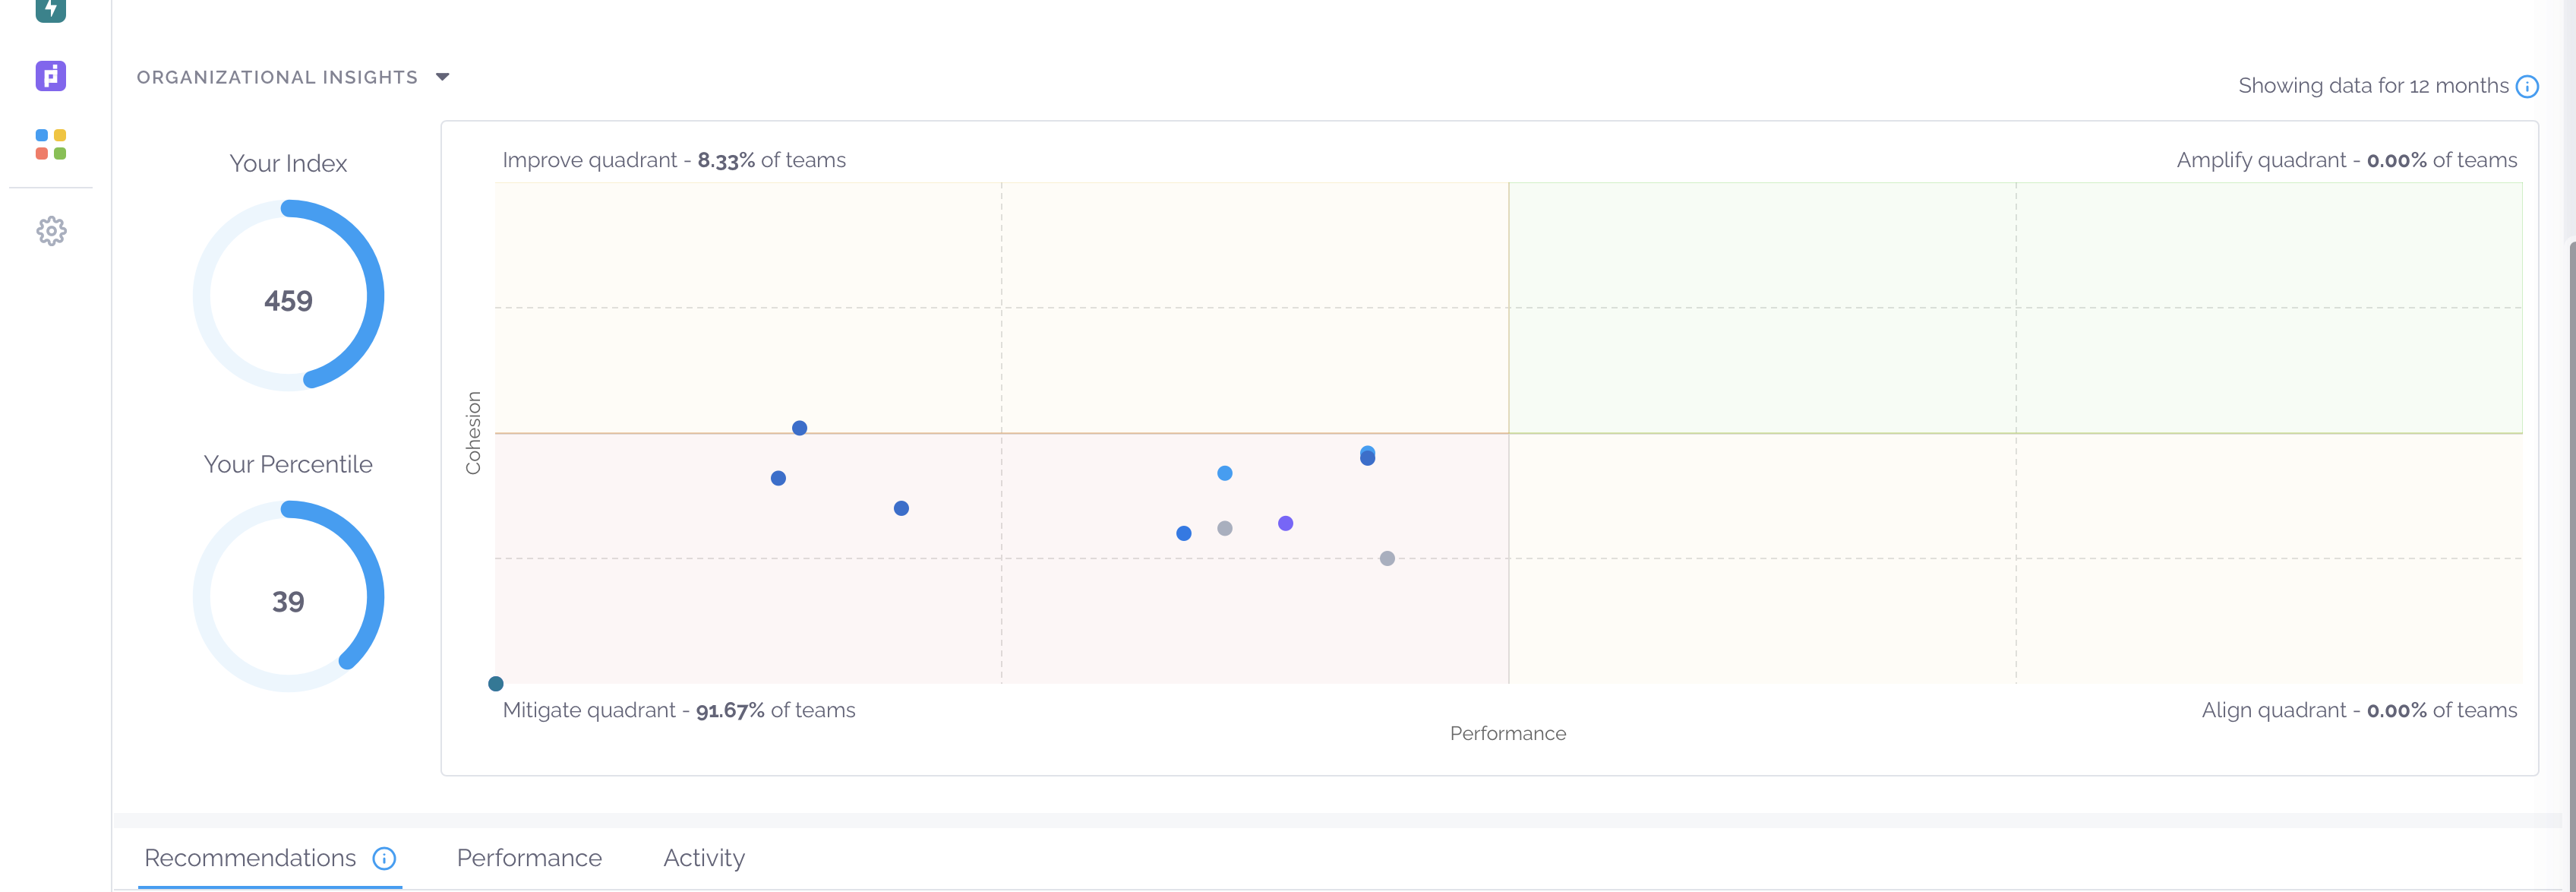
To learn more about the impact matrix feature, please visit our Help Center article Impact Matrix.
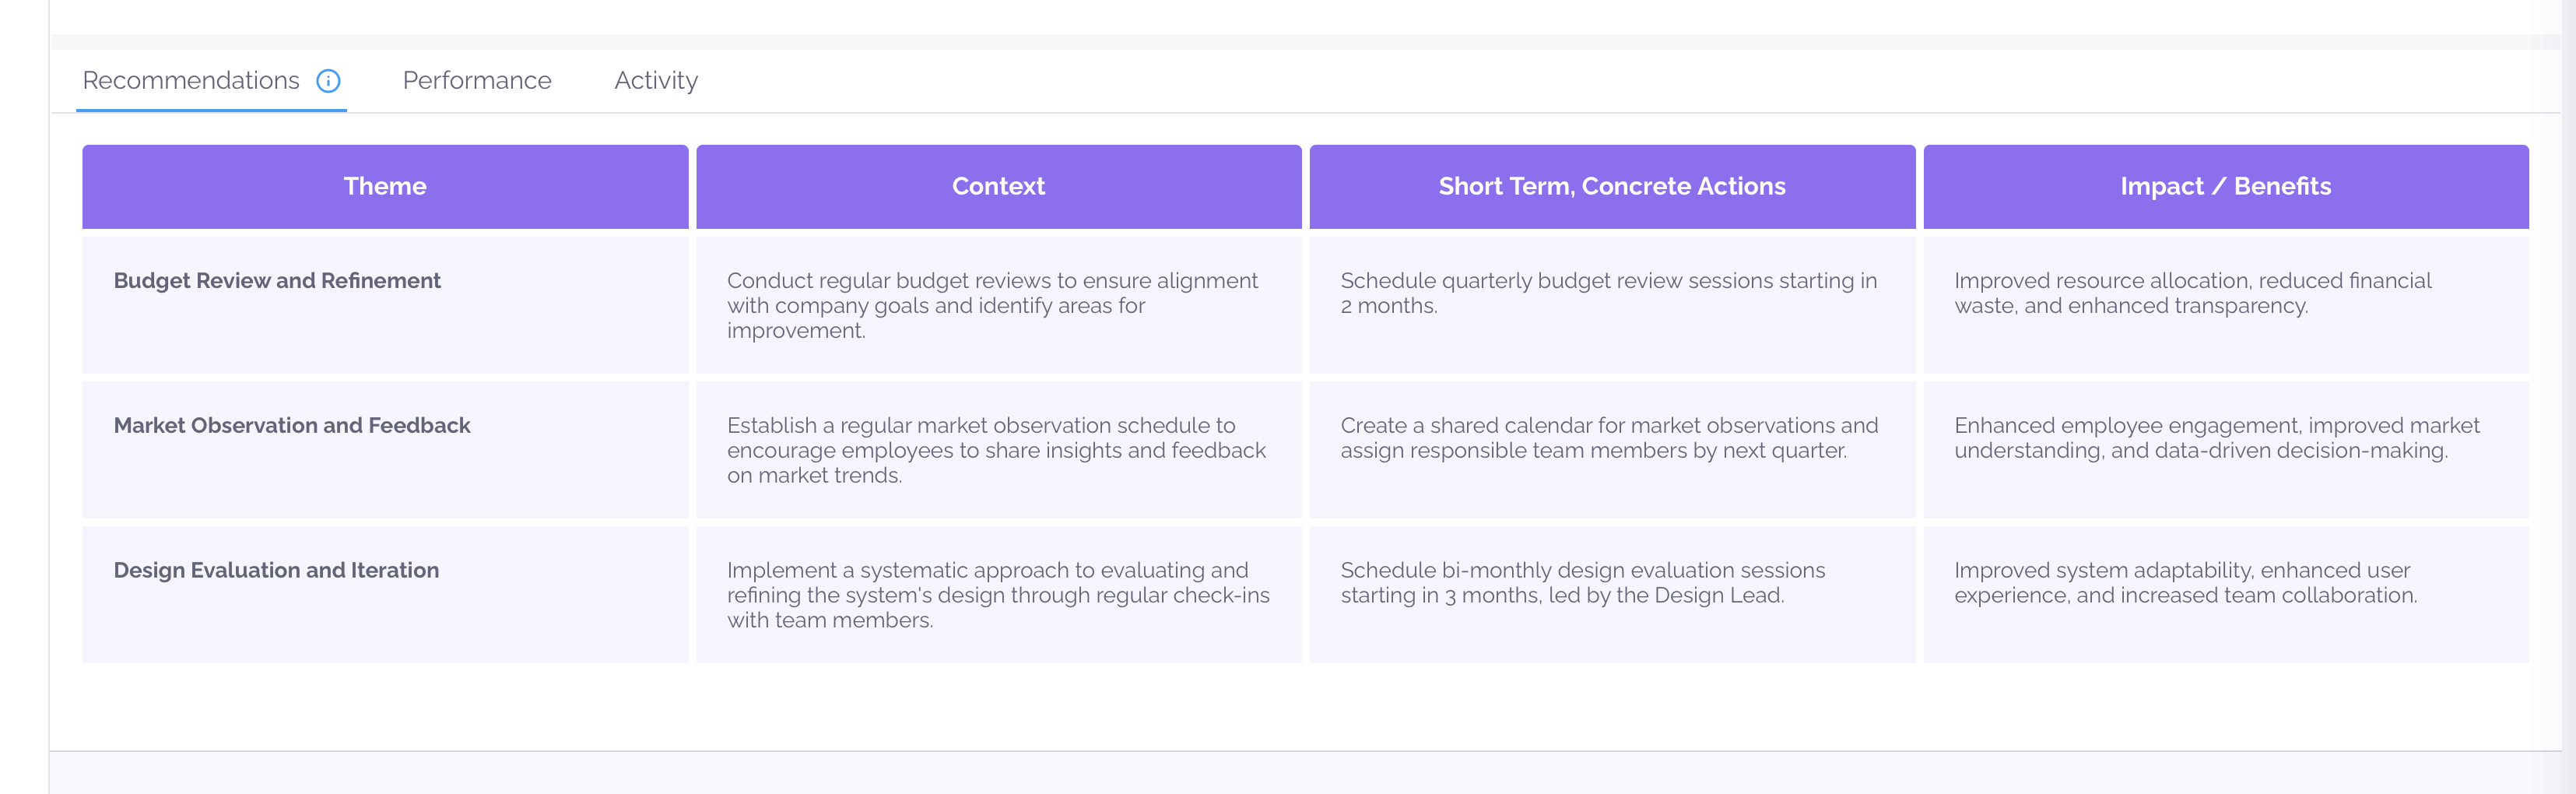
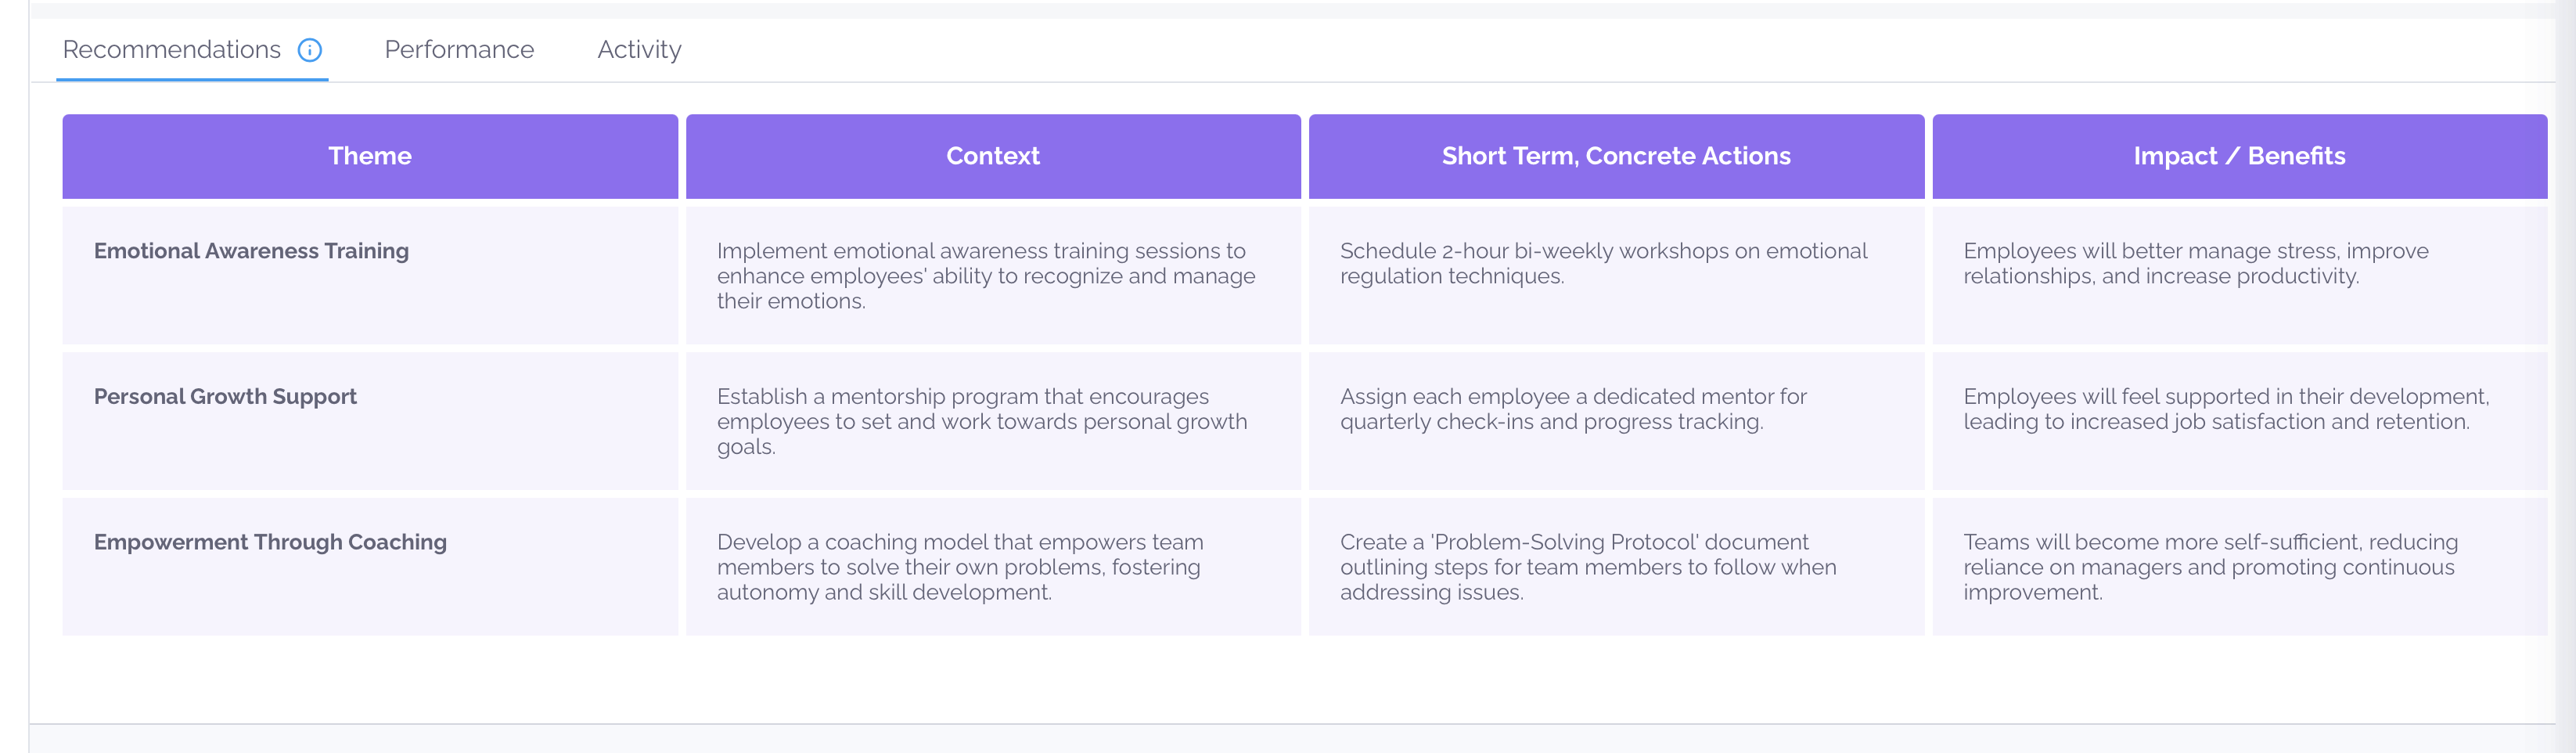
Recommendations
Below the Impact Matrix, you have the ability to read recommendations. They are automatically generated based on collected feedback. These insights suggest improvements in team collaboration, workflows, and organizational effectiveness.
In the screenshot below we show you the recommendations tab
Performance
Next to the Recommendations, you have access to more detailed data on the assessment level. This section allows you to explore specific assessment results and delve deeper into the highest and lowest performing dimensions as well as trends breakdown for each capability.
The short video below shows you the performance tab
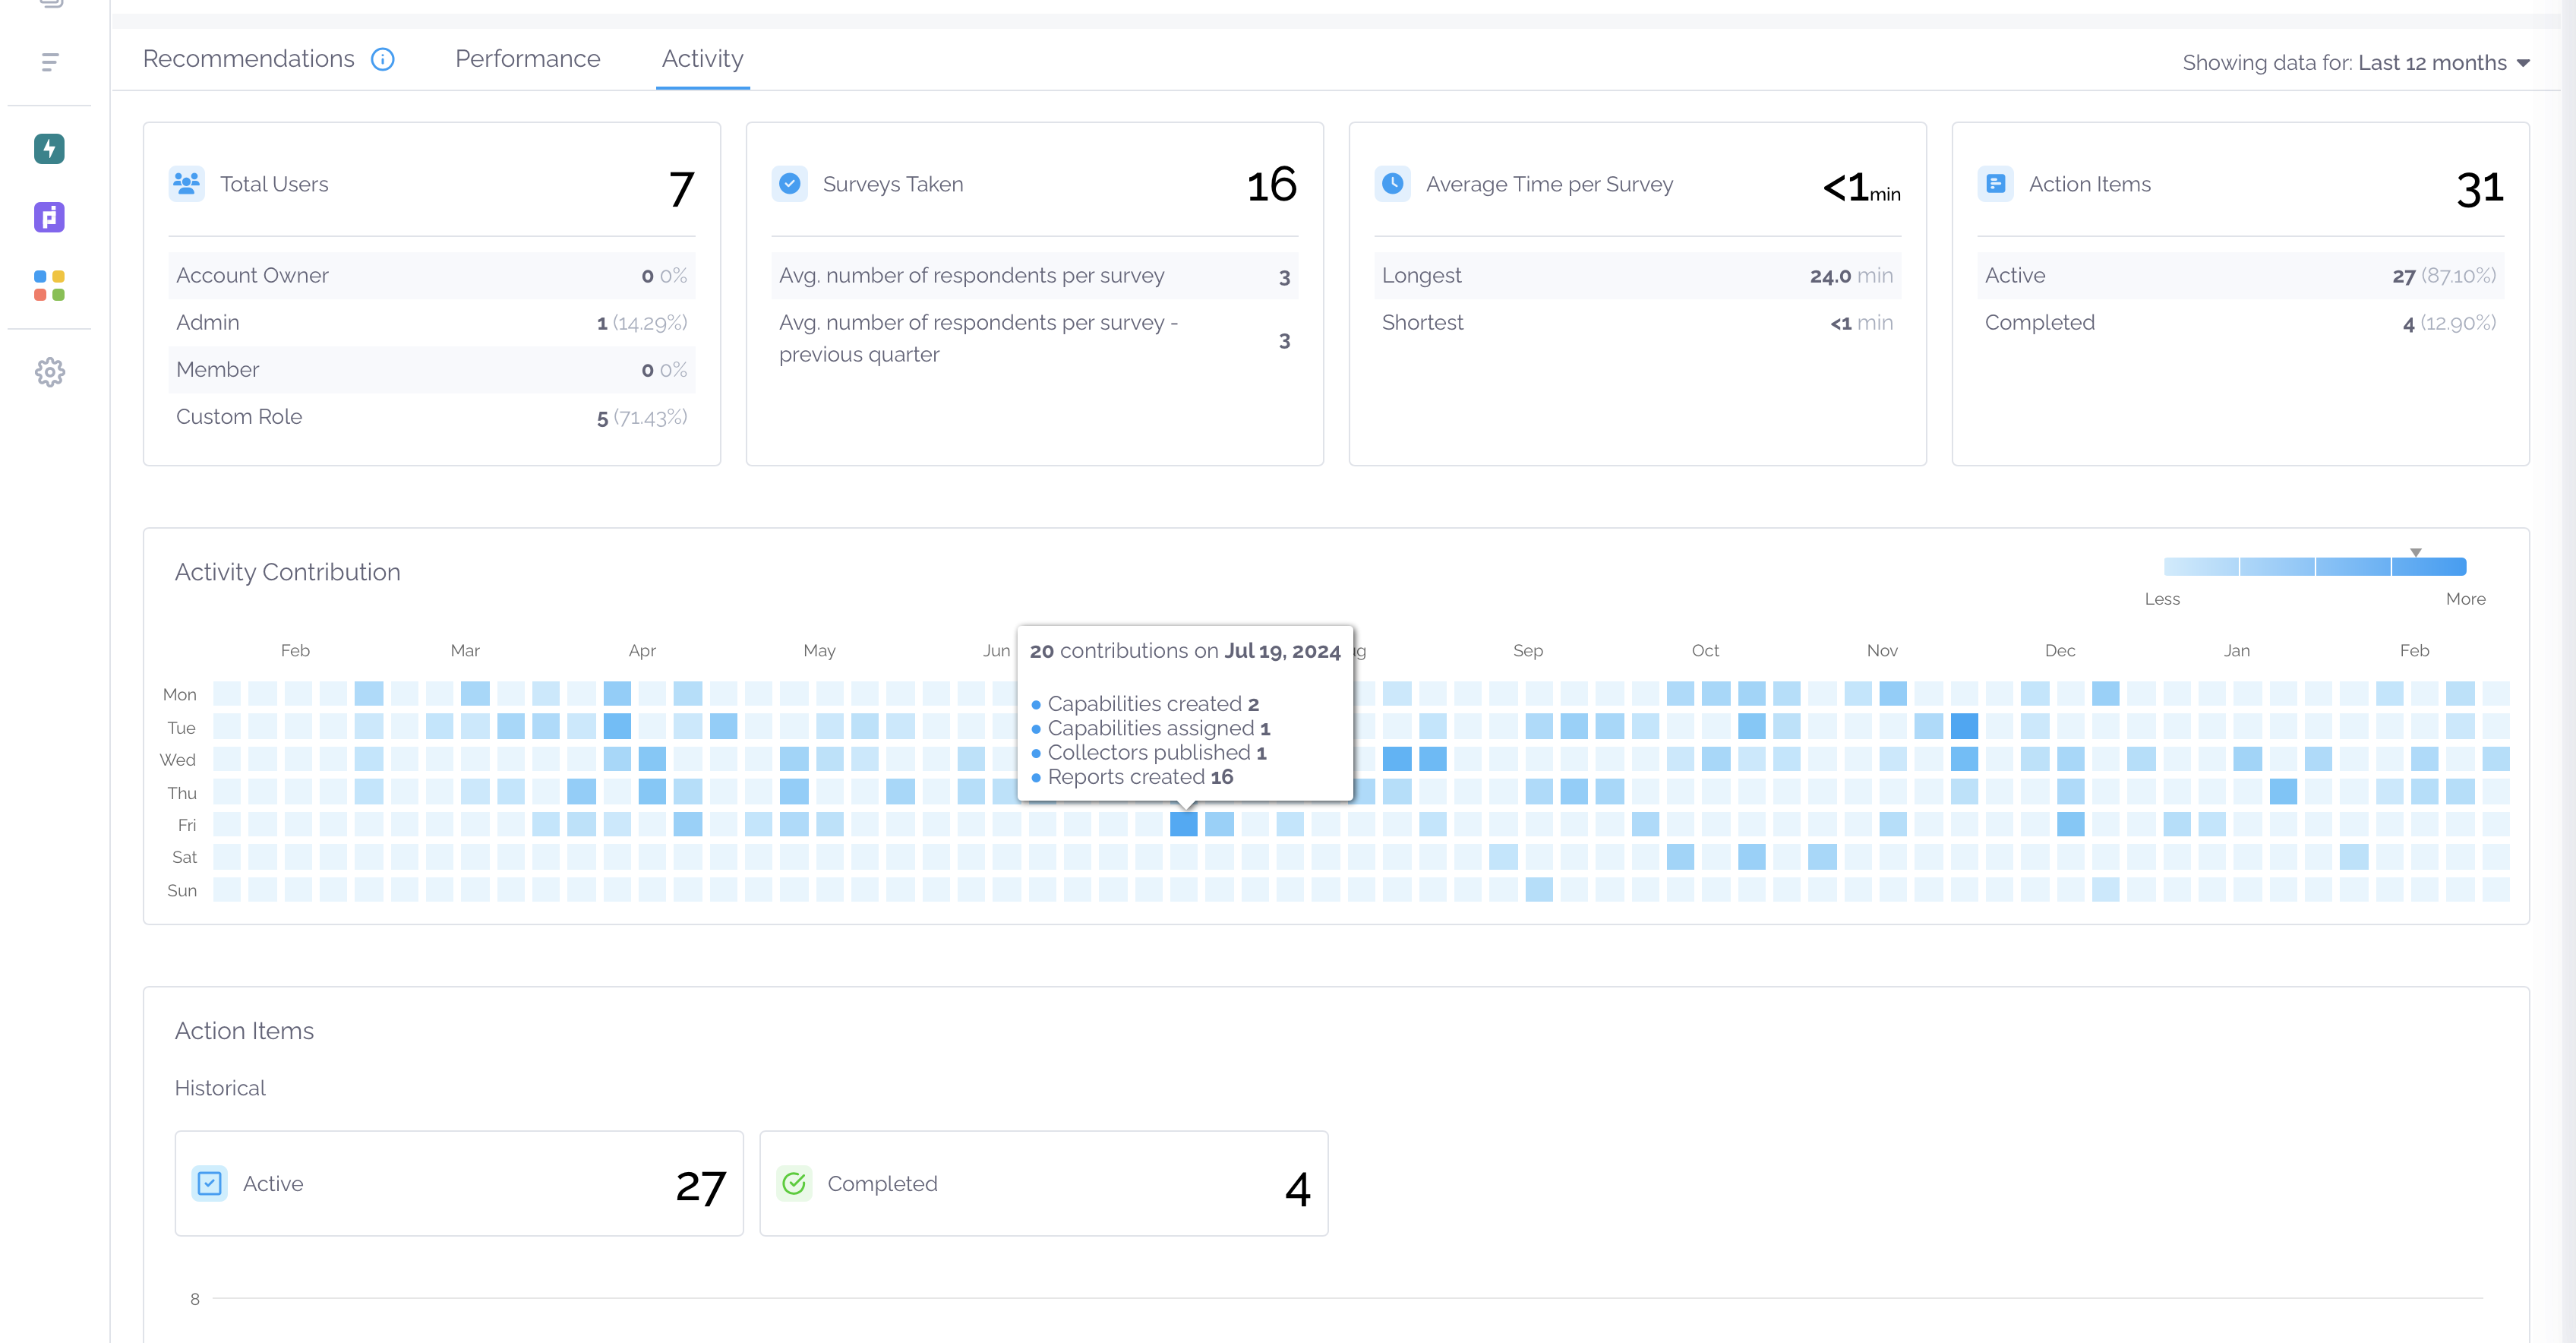
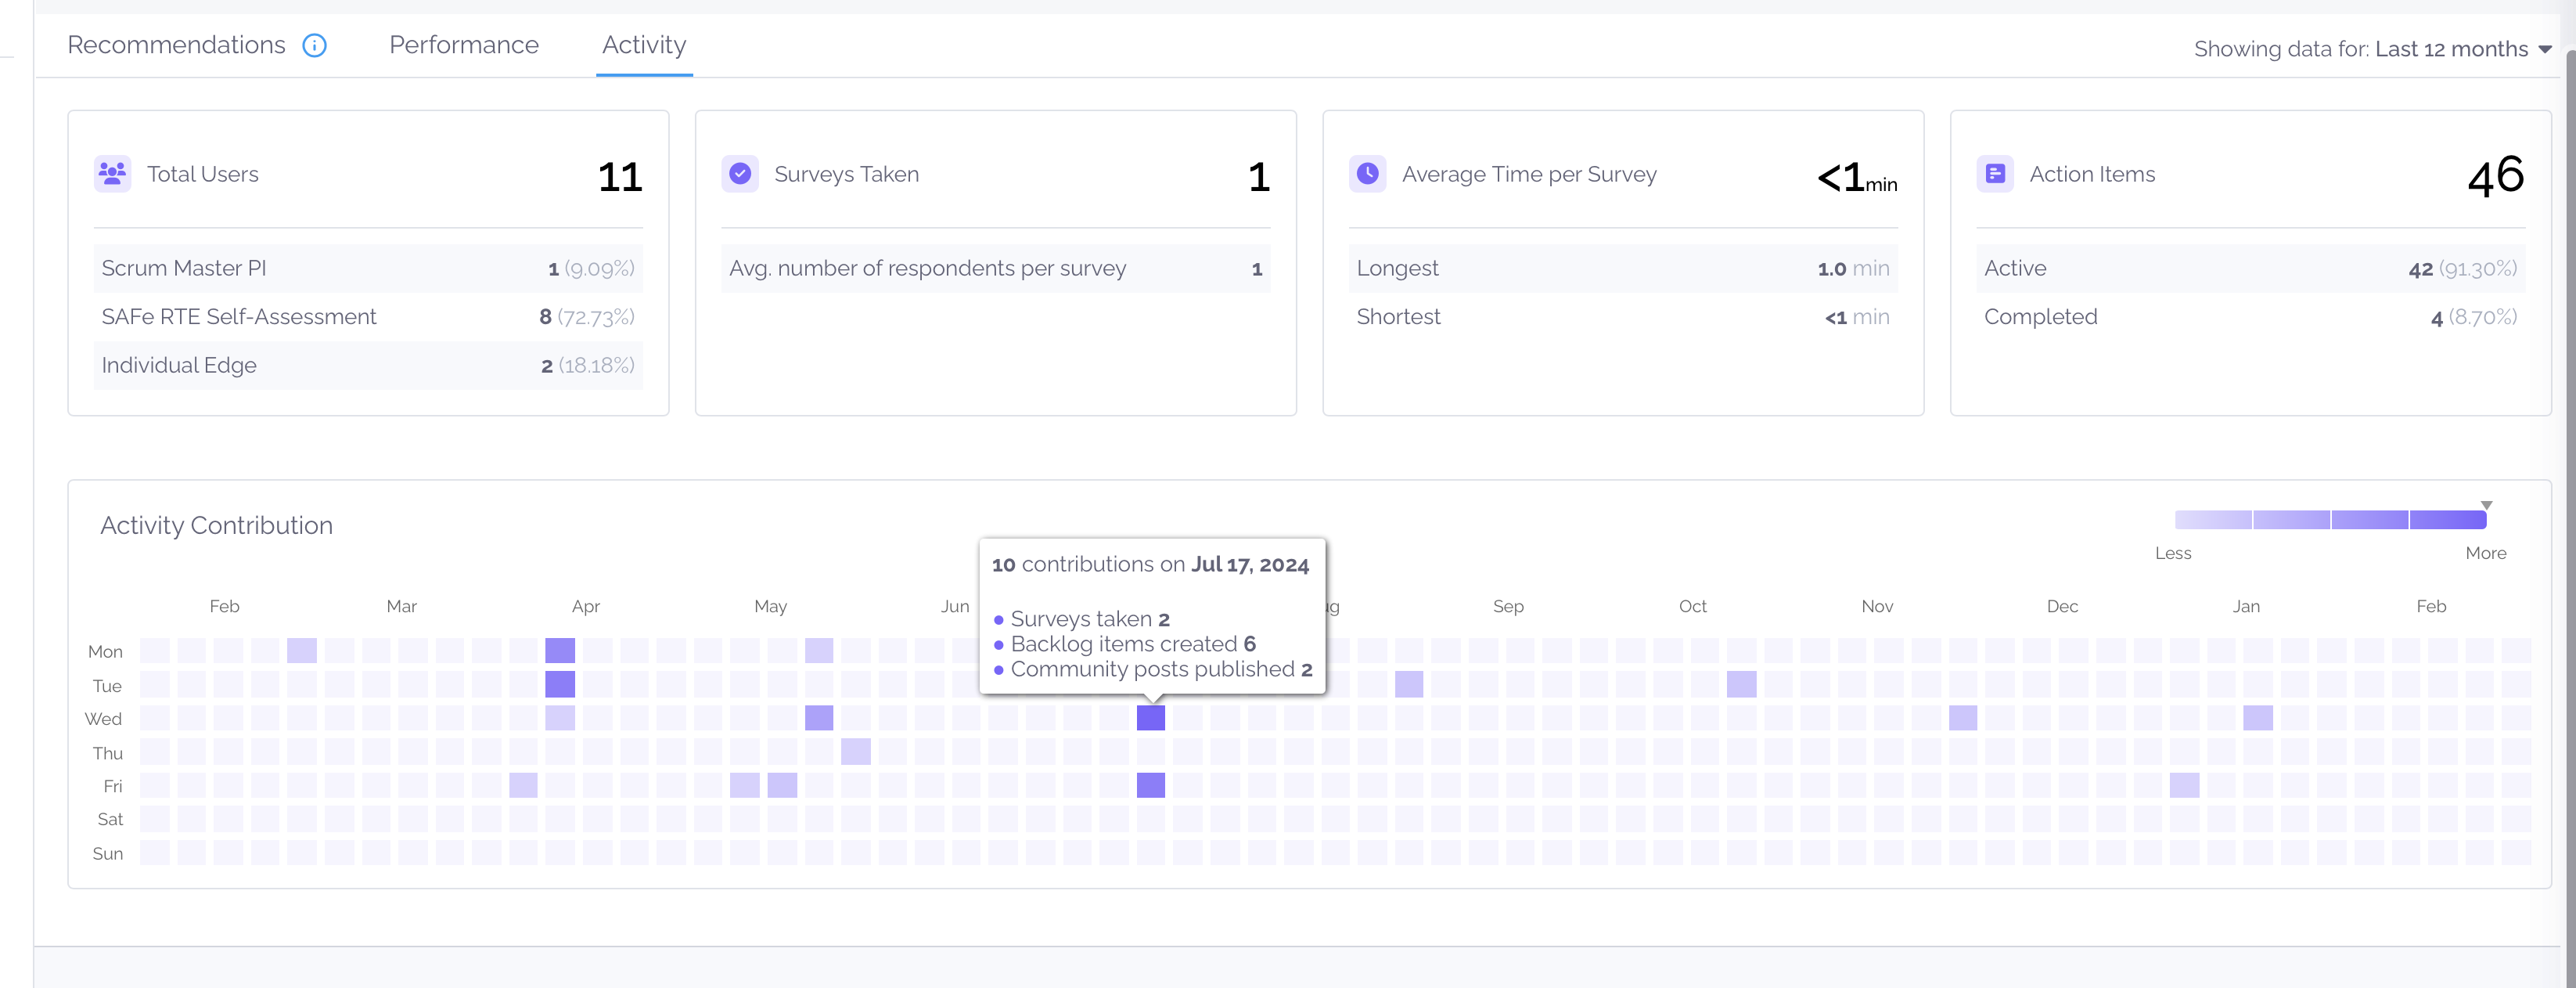
Activity
The activity tab allows you to observe various metrics, including the total number of users, the number of taken surveys, the average time taken per survey, and the current status of active items, indicating how many of them are Active or Completed.
In the screenshot below we show you the activity tab
Personal Improvement Tab
On the Personal Improvement tab, you have the flexibility to explore data for all capabilities listed as filters or select a specific one to conduct a detailed analysis, uncovering recommendations, performance, and activity.
The screenshot below shows you where to find the personal improvement tab
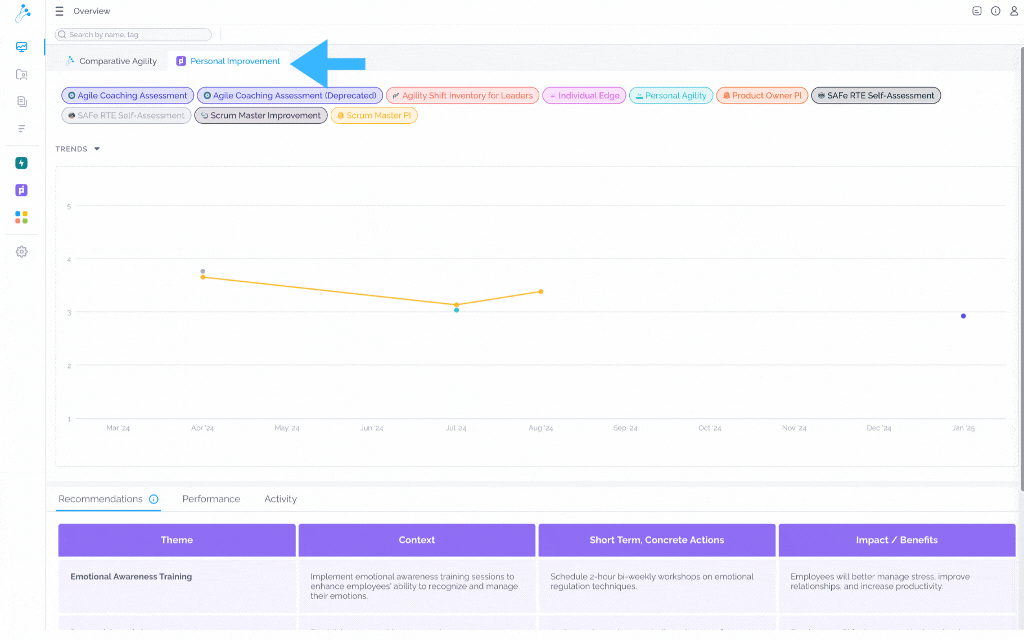
Note: To choose a specific Capability, simply click on it. If you wish to select all of them again, just click on the Capability you have previously selected.
Trends
The Trends Section provides a comprehensive overview of each capability’s progress in Personal Improvement. Supported by data and analytics, it offers a snapshot that enables you to recognize strengths and pinpoint areas for enhancement.
Recommendations
Recommendations are automatically generated based on collected feedback. These insights suggest improvements in team collaboration, workflows, and organizational effectiveness.
In the screenshot below we show you recommendations
Performance
For deeper insights into performance, explore the Performance section, where you can find detailed information about the highest three performing dimensions as well as the lowest three performing dimensions.
Delve deeply into each individual capability to uncover Key Strengths and Opportunities for Improvement.
The short video below shows you the performance tab
Activity
The Activity section provides a live overview of users engaging with Personal Improvement. Here, you can observe various metrics including the total number of users, the number of surveys they’ve completed, the average time taken per survey, and the current status of items in the backlog, indicating how many of them are Active or Completed.
In the screenshot below we show you what the Activity section looks like
If you ever need any assistance or have any questions please reach out to our support team at support@comparativeagility.com and we will be more than happy to assist you.