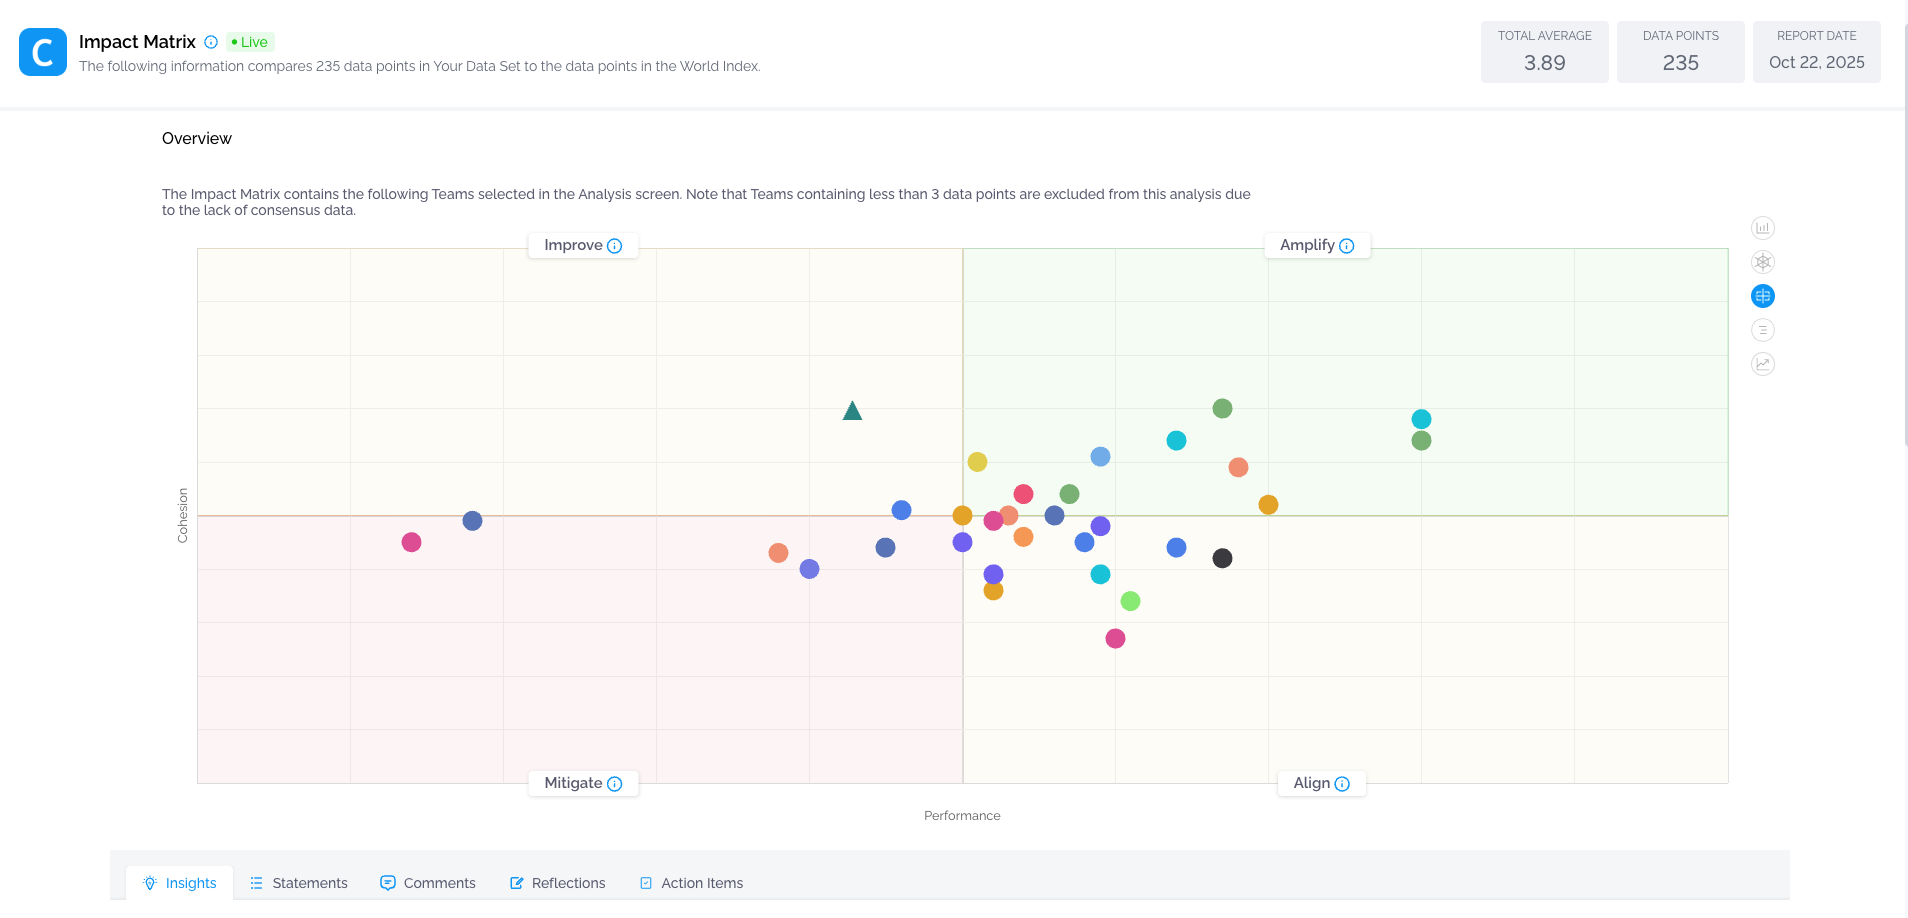
To support organizations in their continuous improvement efforts, Comparative Agility provides several ways for change leaders to analyze data, gather intelligence, and discover insights. This article will explain what an Impact Matrix is and how to read it.
The main goal of the Impact Matrix is to:
- Quickly gain a meaningful perspective of how your teams are doing across the vectors of Performance and Cohesion
- Identify where you – as a change leader – can have the most impact in terms of which teams to focus on
The Impact Matrix uses two proprietary vectors to help map the teams:
- The Performance vector is based on the aggregate average score of the team, with each statement in the survey given a “weighted score”.
- The Cohesion vector is not a straight Standard Deviation, but rather an alternative statistical expression of consensus, aimed at measuring the level of coherence inside the team.
The thesis is that teams that score high on both Cohesion and Performance tend to do well and reside in the “green zone“, whereas teams that do not agree with each other internally and score low on performance are in the “red zone“.
NOTE: We also have “yellow zones” for the other combinations.
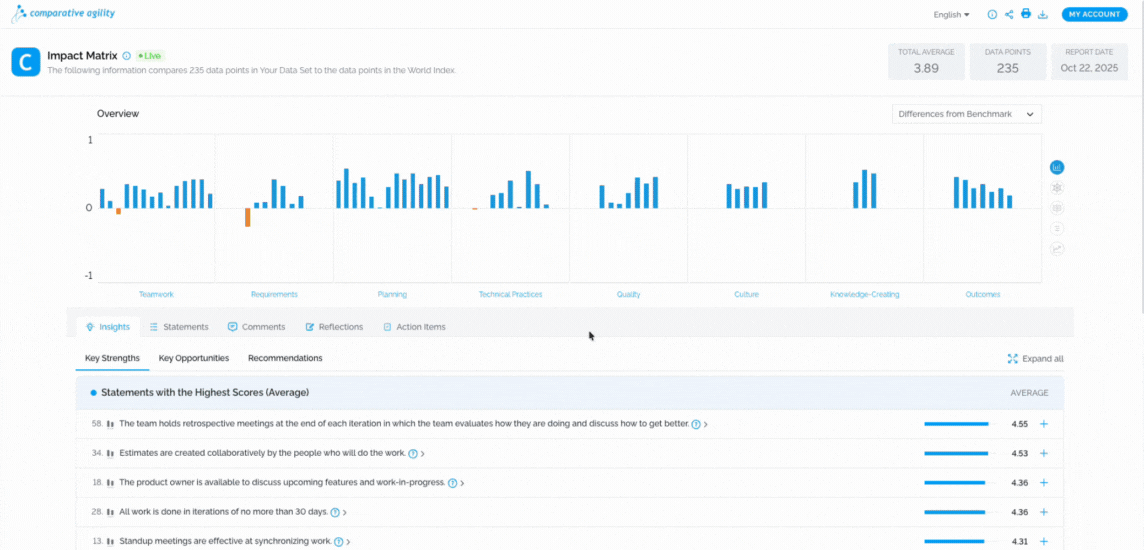
Impact Matrix in the reports
To navigate to the Impact Matrix in the reports, simply:
- Open the desired report
- Click on the Impact Matrix option on the right side of your screen
In the short video below we show you how to navigate to the Impact Matrix in the reports
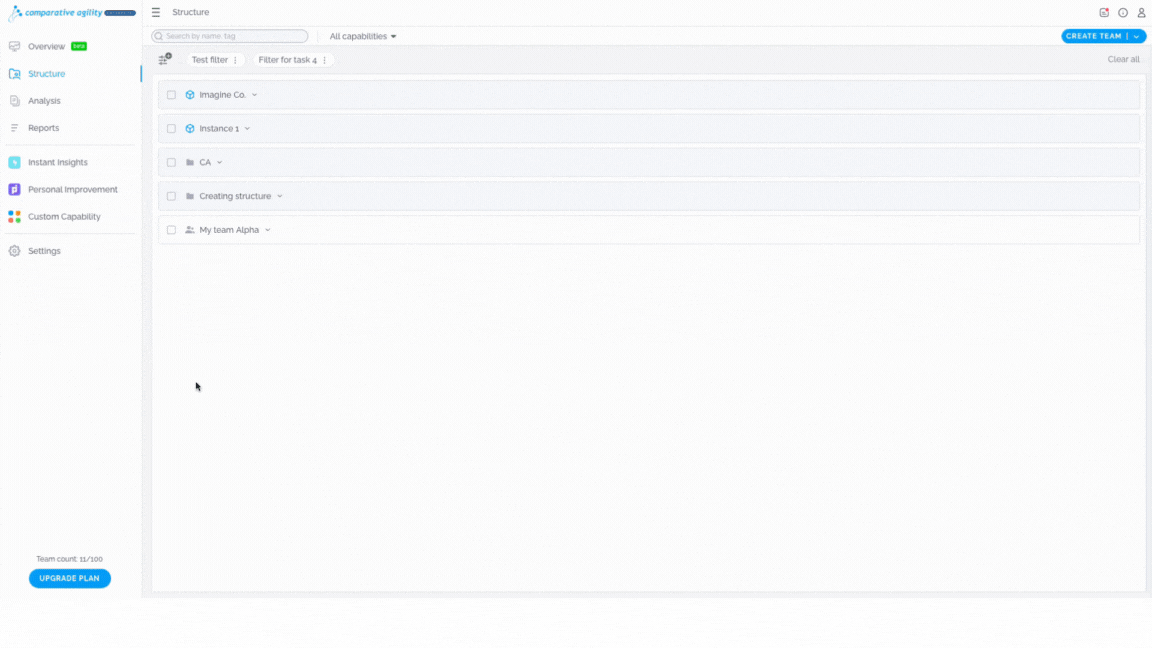
Navigating to the Impact Matrix in the Overview Screen
- Open Overview Screen
- Scroll down to the Impact Matrix
The short video below shows you how to navigate to the Impact Matrix in the Overview Screen
 Four types of Quadrants
- Amplify: High Performance, High Cohesion (Green zone)- Teams in Amplify Quadrant are indicating they perform at a relatively high level and that there are no major disconnects between the team members
- Align: High Performance, Low Cohesion (Yellow zone) – When teams are in the Align Quadrant they are performing well, yet indicate there are significant disagreements and disconnects between team members.
- Mitigate: Low Performance, Low Cohesion (Red Zone) – Teams in the Mitigate Quadrant are indicating they need help: they are expressing that they are not only performing poorly, but they are also disconnected as a team.
- Improve: Low Performance, High Cohesion (Yellow zone) – These teams are performing relatively poorly, but they are aware of their challenges – and typically, therefore, take steps to improve their current situation.
In the screenshot below we show you what the Quadrants look like
If you ever need any assistance or have any questions please reach out to our support team at support@comparativeagility.com and we will be more than happy to assist you.